 01
Macro Analysis
Which states are growing?
Population, new building approvals, lending and job ads, state by state. Start here, so you do not pick a good suburb in a state going backwards.
You end with a state or two
Most people find a house they like and work backwards. That is how you end up in the wrong suburb. These tools take you the other way, one step at a time.
Start at step 1. Each tool hands the next one a smaller list, until you know the streets you want to buy in.
01Which states are growing?
Population, new building approvals, lending and job ads, state by state. Start here, so you do not pick a good suburb in a state going backwards.
You end with a state or two
 02
Which suburbs are worth a look?
Filter every suburb on growth, yield, supply, demand, risk and affordability at once. You get a shortlist instead of a hunch.
You end with 5 to 10 suburbs
 03
Are they getting better or worse?
A suburb can look good today and still be sliding. Trends use rolling windows, so one quiet month cannot fake a trend.
You keep the ones still improving
 04
What is really going on here?
Prices, rents, yield, days on market, stock on market, people and crime. Each shown next to its number a year ago.
You understand one suburb fully
 05
What is around the property?
Every suburb on one map, coloured by the number you pick. Clusters show up on a map in a way they never do in a table.
You find the streets to buy in
Real screens from the tools, with real data. Click either one to see it full size.
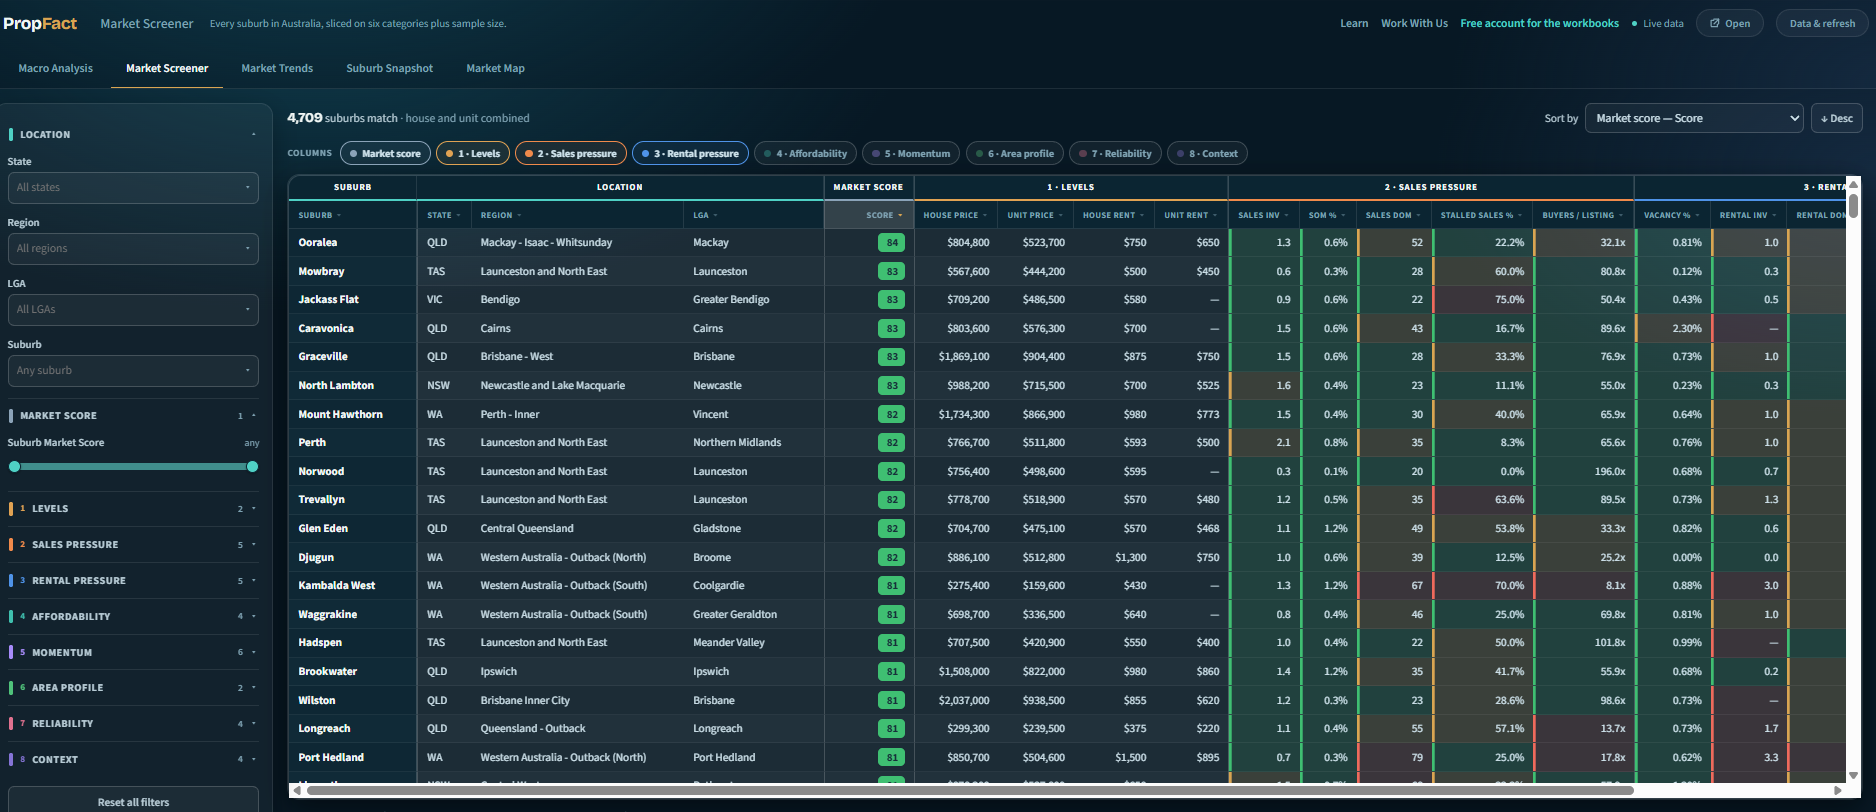
Every suburb in Australia in one table. Filter on price, stock on market, vacancy, yield, growth and data reliability, then sort by market score to get a shortlist.
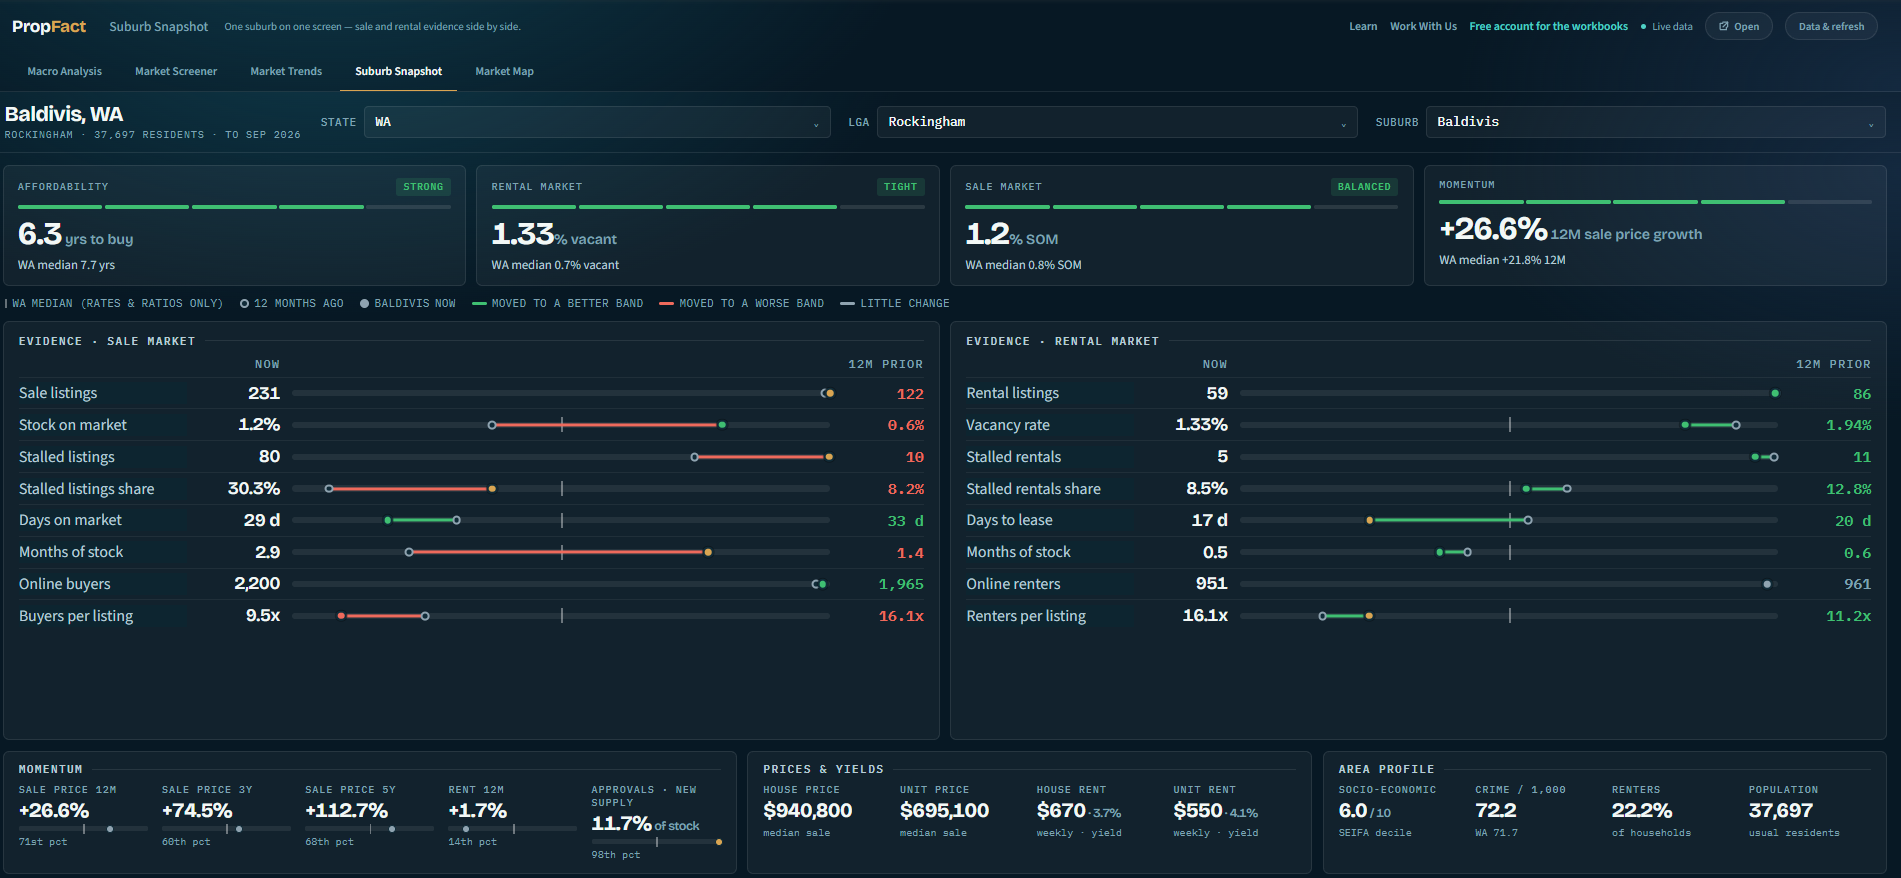
One suburb on one screen. Sale and rental evidence side by side, each number next to where it was a year ago and against the state median.
The tools are a separate $40 a month subscription. They are not included in Plan 2 or Plan 3: in those plans we use them on your purchase and show you what they say, and you can add your own subscription if you want to explore yourself.
Use all five tools yourself, alongside the free course. There is no free tier. Cancel any time and keep access to the end of the month you paid for.
Get the tools, $40 a monthWe use the tools on your search and check the numbers with you, one to one for 3 months. Add your own subscription if you want to use them yourself.
See Plan 2We run the tools and the whole purchase for you. You make the final decision. Add your own subscription only if you want your own access.
See Plan 3Every number shows how many sales sit behind it. A suburb median built on nine sales is not a median. It is noise, and we flag it.